I recently worked with a client, Lydia, who has a beautiful website. The graphics, layout, and branding are perfect.
So why wasn’t Lydia getting more sales?
The first thing we needed to do was some detective work.
Why? Because we don’t know if her problem is that she’s not getting enough traffic to her website or if the problem is that the visitors aren’t converting because of poor copywriting, website design, etc.
Here’s How to be a Website Marketing Detective
First, you must have access to your website statistics. I always recommend that you have Google Analytics installed on your website. The statistics that come with your standard website hosting package are probably not strong enough to help you do the detective work.
Second, you have to know how to find, read and interpret those statistics.
This is just about the time that most people’s eyes glaze over, so let me short-cut the process for you and make it simple.
How Many Visitors Are You Getting Per Month?
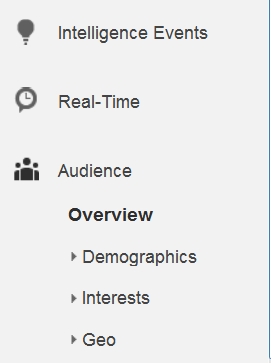
In Google Analytics, look at the menu on the left side of the page.
Find the section called “Audience” and open the menu, then click on the “Overview.”

How many visitors are you getting to your website? Is there an upward trend?
What I have discovered is that the concrete, exact numbers don’t matter as much as the direction they’re going.
Look at your visitor numbers over the course of several months. If the number of visitors is trending upwards, then you’re doing a good job with driving traffic to your site.
Also note that in some months, the visitor count may be down. Sometimes it’s because you’re not doing your marketing properly or consistently that month, and sometimes it’s because it’s a month when your audience traditionally is away from their computers or distracted with other things, like summertime months and big holidays months. So don’t make assumptions about your visitor traffic; get to know your audience and know when they’re most likely to be paying attention to your website and when they’re likely way on vacation or holidays.
Recent studies show that 79% of visitors who come to your website are not ready to buy. If you’re not getting enough traffic to your website, you won’t have enough people interested in buying from you.
Which Pages Are the Most Popular?
Now it’s time to figure out if your visitors are looking at the website pages you want them to look at.
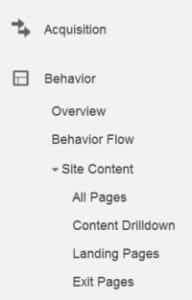
Go back to the left-hand menu in Google Analytics and find the section called “Behavior.” Within that section, there is an area called “Site Content” which gives you information about how visitors are using your website. Go to the “All Pages” sub-area under “Site Content.”

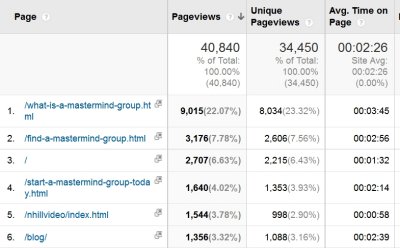
Which pages are viewed most often? You can find this on the chart on the right-hand side of your screen once you select “All Pages.” (See example chart below.)

The two key statistics to review are:
How many Unique Page Views does each page get? You will see two numbers: Page Views and Unique Page Views. Why are there two numbers? Because Google Analytics counts every time the page if viewed, even if one visitor views the page two or three times. So in the example chart, you can see the What Is a Mastermind Group page got viewed 9,015 times, but only 8,034 unique views. This means (roughly) that 981 people viewed the page twice. Unique Views gives you a more realistic guide to how many unique visitors viewed the page and is a more reliable number to watch.
How long are they staying on the page? In the same example, the average visitor viewed the What Is a Mastermind Group page for 3 minutes and 45 seconds. Why do we care? Because if it takes a visitor 3 minutes to read a page, and the average visitor is only on that page for 1 minute, it means they’re not reading your text! Here’s how you can tell how long it should take someone to read your page: Set a stop watch and read the page out loud to yourself, slowly. Because you’re used to seeing this text, you’re likely to skip over words and sentences. By reading it out loud, you are forcing your brain to re-see all the text.
What Results Are You Getting?
So now you know how many visitors are coming to your website, and which pages they’re viewing once they get there. Now look at your actual results.
- How many sales are you making?
- How many prospects are calling you to ask about your services?
- Are they buying your products, classes and groups directly from your website?
Conversion Ratio Example
Let me give you a concrete example. In Lydia’s case, she got 113 people to visit her services page in the past month. She got three phone calls after people visited her website. Her conversion rate is 2.6% (3 divided by 113).
The average website conversation rates are around 1% to 5%, so that means that her website copy is converting prospective clients into paying clients.
Her problem isn’t that she needs to re-write her website copy or design. Her problem is that she needs to drive more traffic to her website.
Conclusions for You
How can you know if you have a problem with driving traffic to your website, or if your problem is that your copywriting needs work? Do the math above.
- If your conversion rate is less than 1%, then you need help with your copywriting or website design.
- If people don’t stay on your pages long enough to read them, you need help with your copywriting or website design.
- If the number of visitors you’re getting to your website is low, or if the trend is not on the rise, you need help with driving traffic to your website.
Note that if you’re driving traffic to your website through email marketing or social media marketing, and your audience is a devoted following, you conversation rates should be much higher than 1%.
Now that you know how to read these basic statistics on Google Analytics, you can take control of your marketing and make changes for the better!
Was This Helpful?
I know that statistics can be daunting. If this was helpful to you and you’d like me to show you more (simple) ways to get important data from Google Analytics and interpret it for your small business, please let me know in the comments section below. I love statistics because they let me play marketing detective and figure out what’s true in my business — and that’s how my business remains successful! I’m happy to write more blog posts like this if you want this type of information. 🙂

 How To Create A “Perfect” Life: Kathleen’s Story

Thank you Karyn. I thought the process would be far more time consuming but you simplified it so nicely.
Thank you! Thank you! I don’t like numbers, not really. You made it easy for me to understand how to look at my site stats to see what I am doing correctly and incorrectly. I love your detective model. 🙂
Karyn…
Please continue with more information, tips and analytic approaches to how to better use the ‘numbers’ in business. Although I use performance analytics constantly in my business coaching practice there is always more to learn from others who are very, very good at what they do. Like you!
Thanks.
Will do, Dave! 🙂
Thanks Karyn! This was helpful.
As ALWAYS! Your CONTENT is KING! thank you for always writing helpful stuff Karyn!
You’re welcome, Cena, I’m glad you find the articles helpful. 🙂
Thanks Karyn – this was a great read. Very helpful information!
Great piece Karyn!
I am just finishing up some if the content details of a new website and the information simplified and clarified what was most important to consider.
Well done!
Ron
I’m glad you found it helpful, Ron. Having statistics is fine, but knowing how to use them to solve a problem…priceless! 🙂
Karyn,
Great information! You explained the statistics in a clear, easy to understand way that enabled me to get a clear picture of my site. Please provide additional insights into the Google Analytics statistics.
Thank you!
Thanks, Marie, as I come up with different marketing mysteries my clients experience (that can be solved using clues found in Google Analytics), I’ll be writing more posts like this. 🙂
I vote YES on more blog posts like this, Karyn! I’m a data geek, too! 🙂
This post is particularly awesome because you’ve “translated” a topic that’s often perceived as insanely complicated into “normal-person-language.” I will be sharing it with several people!
Possible future topic… email open & click-thru rates (i.e. intriguing subject lines, motivating calls-to-action, images, HTML vs text-only, etc.).
Bravo! Thanks for sharing your brain!
I think that’s the key, Cynthia…to take these numbers and ascribe meaning to them so they become helpful to small business owners. Numbers by themselves are just a jumble; numbers with translation are magic!
Thanks for the future topics ideas…woo hoo! 🙂
Very meaningful information. Is Google Analytics good for blogs too?
Hi, Carol,
Yes, you can use Google Analytics on blogs as well as HTML/CSS websites. It’s always helpful to know which blog posts get the most attention…it’s like your audience is voting on which topics interest them the most.
Extremely useful information. Please keep it flowing!
Thanks, Bud
When I create a new post, I look for relevant content on my site and provide a link to that entry. I am going to get back on my site and work hard, not only on posting three time a week but a compelling content as you said.
Karyn,
Great post on site analytics. I love how you used a real-life example from a client of yours. Very helpful.
Looking at your site’s analytics is so important. Like you said, it’ll help you get to the root of the problem. I’m glad you and your client could figure it out.
Hope to connect soon,
Dennis